Googleがコミュニティモビリティレポートを公開している。これはGoogleアカウントのロケーション履歴を有効にしているユーザー(サンプルベース)のデータに基づいた移動データで、2020 年 1 ⽉ 3 ⽇〜2 ⽉ 6 ⽇の 5 週間における該当曜⽇の中央値を基準とした増減のデータになっている。詳細はモビリティ レポートの CSV ドキュメントを参照。今回はこのデータを使って、Pythonで時系列クラスタリングをすると同様にPythonのtslearnを使って時系列クラスタリングを行う。
環境
モビリティレポートの可視化
モビリティレポートのcsvには世界中のデータが含まれるが、ここでは日本の都道府県ごとのデータのみを使う。まずはcsvをPandasのDataFrameとして読み込んで中身を確認。sub_region_1が都道府県のカラムで、retail_and_recreation_percent_change_from_baselineからresidential_percent_change_from_baselineが場所カテゴリごとの移動データになっている。
import pandas as pd

# Googleモビリティレポートのファイルパス
# 2020年1月3日から2月6日の5週間の曜日別中央値を基準とした値
MOBILITY_CSV_GOOGLE = 'Global_Mobility_Report.csv'

dfg = pd.read_csv(MOBILITY_CSV_GOOGLE)
dfg.info()
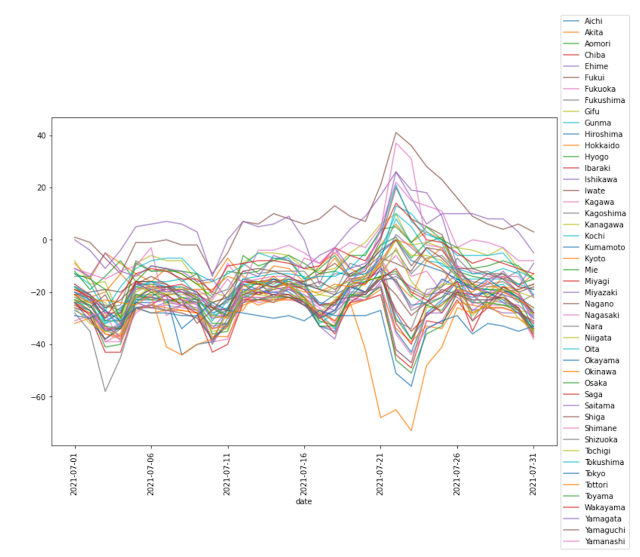
7月の都道府県ごとのtransit_stations_percent_change_from_baseline(公共交通機関の拠点)のデータを可視化してみる。
%matplotlib inline

import matplotlib.pyplot as plt
import pandas as pd

# Googleモビリティレポートのファイルパス
# 2020年1月3日から2月6日の5週間の曜日別中央値を基準とした値
MOBILITY_CSV_GOOGLE = 'Global_Mobility_Report.csv'

# 対象とする場所のカテゴリ
# 公共交通機関の拠点(例: 地下鉄、バス、電車の駅)など
MOBILITY_CATEGORY = 'transit_stations_percent_change_from_baseline'

dfg = pd.read_csv(MOBILITY_CSV_GOOGLE)
# 都道府県ごとのデータを取得
dfg_jp = dfg[dfg['country_region_code']=='JP'].dropna(subset=['sub_region_1'])

# 都道府県のチェック
pref = dfg_jp['sub_region_1'].unique()
print(pref)
assert len(pref) == 47

# 日付をインデックス、都道府県をカラムとするDataFrameに変換
dfg_cat = dfg_jp.set_index(['date', 'sub_region_1'])[MOBILITY_CATEGORY].unstack()

# 2021年7月のデータを取得
dfg_cat_jul = dfg_cat['2021-07-01':'2021-07-31']

# データのプロット
ax = dfg_cat_jul.plot(figsize=(12,8), alpha=0.75, rot=90);
ax.legend(loc='center left', bbox_to_anchor=(1.0, 0.5))
plt.show()
クラスター数を決める
データをk-means法で時系列クラスタリングするが、k-means法では事前にクラスター数を決める必要がある。クラスタリングの前にシルエット値からクラスター数を決定する。シルエット値はk-means法の最適なクラスター数を選択するでも使用しているが、今回はSelecting the number of clusters with silhouette analysis on KMeans clusteringを参考にシルエット値をプロットして確認してみる。なお、メトリックとしてユークリッド距離を使う。
以下はクラスター数2~5の範囲でシルエット値を算出してプロットするコード。scikit-learnにはデータごとのシルエット値を返してくれるsilhouette_samplesメソッドがあるがtslearnにはないので自作した。平均シルエット値が1に近く、プロット幅がなるべく均等になるクラスター数がよいと言われている。
%matplotlib inline

import matplotlib.pyplot as plt
import matplotlib.cm as cm
import numpy as np
import pandas as pd

from tslearn.clustering import TimeSeriesKMeans, silhouette_score
from tslearn.preprocessing import TimeSeriesScalerMinMax
from tslearn.utils import to_time_series_dataset
from scipy.spatial.distance import cdist
from sklearn.metrics import silhouette_samples as sklearn_silhouette_samples

# Googleモビリティレポートのファイルパス
# 2020年1月3日から2月6日の5週間の曜日別中央値を基準とした値
MOBILITY_CSV_GOOGLE = 'Global_Mobility_Report210814.csv'

# 対象とする場所のカテゴリ
# 公共交通機関の拠点(例: 地下鉄、バス、電車の駅)など
MOBILITY_CATEGORY = 'transit_stations_percent_change_from_baseline'


def silhouette_samples(X, labels, **kwds):
    """シルエット値の計算
    ユークリッド距離の計算方法は以下tslernのコードを参照
    https://github.com/tslearn-team/tslearn/blob/42a56cc/tslearn/clustering/utils.py#L66-L197
    """

    X_ = X.reshape((X.shape[0], -1))
    sklearn_X = cdist(X_, X_, metric='euclidean')

    # 計算済みのデータを渡すのでmetric='precomputed'にする
    return sklearn_silhouette_samples(X=sklearn_X,
                                  labels=labels,
                                  metric='precomputed',
                                  **kwds)


def plot_silhouette_scores(ts_data, silhouette_values, n_clusters, km):
    """シルエット値のプロット
    以下のコードをほぼコピー
    https://scikit-learn.org/stable/auto_examples/cluster/plot_kmeans_silhouette_analysis.html#sphx-glr-auto-examples-cluster-plot-kmeans-silhouette-analysis-py
    """
    cluster_labels = km.labels_
    centers = km.cluster_centers_

    # Create a subplot with 1 row and 2 columns
    fig, (ax1, ax2) = plt.subplots(1, 2)
    fig.set_size_inches(18, 7)

    ax1.set_xlim([-0.1, 1])
    # The (n_clusters+1)*10 is for inserting blank space between silhouette
    # plots of individual clusters, to demarcate them clearly.
    ax1.set_ylim([0, len(ts_data) + (n_clusters + 1) * 10])

    y_lower = 10
    for i in range(n_clusters):
        # Aggregate the silhouette scores for samples belonging to
        # cluster i, and sort them
        ith_cluster_silhouette_values = \
            silhouette_values[cluster_labels == i]

        ith_cluster_silhouette_values.sort()

        size_cluster_i = ith_cluster_silhouette_values.shape[0]
        y_upper = y_lower + size_cluster_i

        color = cm.nipy_spectral(float(i) / n_clusters)
        ax1.fill_betweenx(np.arange(y_lower, y_upper),
                          0, ith_cluster_silhouette_values,
                          facecolor=color, edgecolor=color, alpha=0.7)

        # Label the silhouette plots with their cluster numbers at the middle
        ax1.text(-0.05, y_lower + 0.5 * size_cluster_i, str(i))

        # Compute the new y_lower for next plot
        y_lower = y_upper + 10  # 10 for the 0 samples

    ax1.set_title("The silhouette plot for the various clusters.")
    ax1.set_xlabel("The silhouette coefficient values")
    ax1.set_ylabel("Cluster label")

    # The vertical line for average silhouette score of all the values
    ax1.axvline(x=np.mean(silhouette_values), color="red", linestyle="--")

    ax1.set_yticks([])  # Clear the yaxis labels / ticks
    ax1.set_xticks([-0.1, 0, 0.2, 0.4, 0.6, 0.8, 1])

    # 2nd Plot showing the actual clusters formed
    colors = cm.nipy_spectral(cluster_labels.astype(float) / n_clusters)
    ax2.scatter(ts_data[:, 0], ts_data[:, 1], marker='.', s=30, lw=0, alpha=0.7,
                c=colors, edgecolor='k')

    # Labeling the clusters
    # centers = clusterer.cluster_centers_
    # Draw white circles at cluster centers
    ax2.scatter(centers[:, 0], centers[:, 1], marker='o',
                c="white", alpha=1, s=200, edgecolor='k')

    for i, c in enumerate(centers):
        ax2.scatter(c[0], c[1], marker='$%d$' % i, alpha=1,
                    s=50, edgecolor='k')

    ax2.set_title("The visualization of the clustered data.")
    ax2.set_xlabel("Feature space for the 1st feature")
    ax2.set_ylabel("Feature space for the 2nd feature")

    plt.suptitle(("Silhouette analysis for KMeans clustering on sample data "
                  "with n_clusters = %d" % n_clusters),
                 fontsize=14, fontweight='bold')

    plt.show()


def show_silhouette_scores(ts_data, dates):
    # クラスター数2-5を確認
    for n_clusters in range(2, 6):
        print('クラスター数 =', n_clusters)

        km = TimeSeriesKMeans(n_clusters=n_clusters, metric='euclidean', verbose=False, random_state=1).fit(ts_data)
        assert len(km.labels_) == 47
        print('クラスタリング結果 =', km.labels_)

        silhouette_values = silhouette_samples(ts_data, km.labels_)
        silhouette_avg = np.mean(silhouette_values)
        print('シルエット値平均 =', silhouette_avg)

        plot_silhouette_scores(ts_data, silhouette_values, n_clusters, km)


dfg = pd.read_csv(MOBILITY_CSV_GOOGLE)

# 都道府県ごとのデータを取得
dfg_jp = dfg[dfg['country_region_code']=='JP'].dropna(subset=['sub_region_1'])

# 都道府県のチェック
pref = dfg_jp['sub_region_1'].unique()
print(pref)
assert len(pref) == 47

# 日付をインデックス、都道府県をカラムとするDataFrameに変換
dfg_cat = dfg_jp.set_index(['date', 'sub_region_1'])[MOBILITY_CATEGORY].unstack()

# 2021年7月のデータを取得
dfg_cat_jul = dfg_cat['2021-07-01':'2021-07-31']

# データのプロット
ax = dfg_cat_jul.plot(figsize=(12,8), alpha=0.75, rot=90);
ax.legend(loc='center left', bbox_to_anchor=(1.0, 0.5))
plt.show()

# 正規化
ts_data = TimeSeriesScalerMinMax().fit_transform(dfg_cat_jul.values.transpose())

prefs = dfg_cat_jul.columns
dates = dfg_cat_jul.index

show_silhouette_scores(ts_data, dates)
実際にはクラスター数2から5の結果が表示されるが、以下はクラスター数4の結果。平均シルエット値だけをみると他のクラスター数がよさそうだが、ここではクラスター数4を採用する。
時系列クラスタリングの結果を可視化
クラスター数が決まったので、時系列クラスタリングして、クラスターごとの平均を可視化してみる。
%matplotlib inline

import matplotlib.pyplot as plt
import matplotlib.cm as cm
import numpy as np
import pandas as pd

from tslearn.clustering import TimeSeriesKMeans, silhouette_score
from tslearn.preprocessing import TimeSeriesScalerMinMax
from tslearn.utils import to_time_series_dataset
from scipy.spatial.distance import cdist
from sklearn.metrics import silhouette_samples as sklearn_silhouette_samples

# Googleモビリティレポートのファイルパス
# 2020年1月3日から2月6日の5週間の曜日別中央値を基準とした値
MOBILITY_CSV_GOOGLE = 'Global_Mobility_Report210814.csv'

# 対象とする場所のカテゴリ
# 公共交通機関の拠点(例: 地下鉄、バス、電車の駅)など
MOBILITY_CATEGORY = 'transit_stations_percent_change_from_baseline'


## シルエット値プロット用の関数は省略 ##


def tsclustering(ts_data, prefs, n_clusters):

    km = TimeSeriesKMeans(n_clusters=n_clusters, metric='euclidean', verbose=False, random_state=1).fit(ts_data)

    # クラスタリングの結果
    result = pd.DataFrame({'clust': km.labels_}, index=prefs)
    for clust, g in result.groupby(by='clust'):
        print('Cluster: ', clust)
        print(g.index)

    # クラスターごとの中心をプロット
    for i, c in enumerate(km.cluster_centers_):
        plt.plot(c.T[0], label=i)

    plt.legend(loc='center left', bbox_to_anchor=(1, 0.5))
    plt.show()


dfg = pd.read_csv(MOBILITY_CSV_GOOGLE)
# 都道府県ごとのデータを取得
dfg_jp = dfg[dfg['country_region_code']=='JP'].dropna(subset=['sub_region_1'])

# 都道府県のチェック
pref = dfg_jp['sub_region_1'].unique()
print(pref)
assert len(pref) == 47

# 日付をインデックス、都道府県をカラムとするDataFrameに変換
dfg_cat = dfg_jp.set_index(['date', 'sub_region_1'])[MOBILITY_CATEGORY].unstack()

# 2021年7月のデータを取得
dfg_cat_jul = dfg_cat['2021-07-01':'2021-07-31']

# データのプロット
ax = dfg_cat_jul.plot(figsize=(12,8), alpha=0.75, rot=90);
ax.legend(loc='center left', bbox_to_anchor=(1.0, 0.5))
plt.show()

# 正規化
ts_data = TimeSeriesScalerMinMax().fit_transform(dfg_cat_jul.values.transpose())

prefs = dfg_cat_jul.columns
dates = dfg_cat_jul.index

# show_silhouette_scores(ts_data, dates)

n_clusters = 4
tsclustering(ts_data, prefs, n_clusters=n_clusters)
時系列クラスタリングの結果は以下の通り。4連休での差が大きい。4連休で最も移動が減少しているクラスター2には東京、大阪、愛知などの大都市圏が含まれる。逆に4連休に移動が上昇したクラスター1,3には地方の都道府県が含まれている。クラスター2に沖縄県が入っているが、これは台風で天候が悪かった影響と考えられる。


0 件のコメント:
コメントを投稿