Pythonのmatplotlibでラベル付き散布図を作成するのようにMatplotlibでプロットした要素にテキストのラベルを付与することがあるが、こういうときに各要素が近いと、ラベルが重なってしまうことがある。
このように重なってしまっているテキストラベルを、PythonライブラリのadjustTextを使うと簡単に重ならないようにできる。以下にその手順をまとめておく。
Windows10(1903)のWSL(Ubuntu 18.04)とJupyter Notebookを使用。
adjustTextはpipでインストールできる。
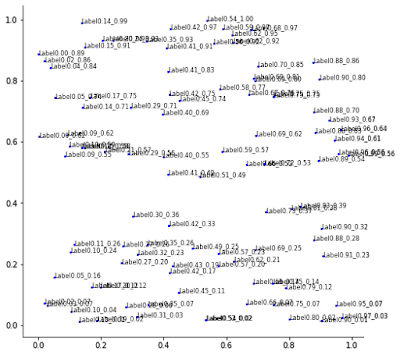
まずはadjustTextを使わずに散布図を作成する。
ラベルがけっこう重なってしまっている。

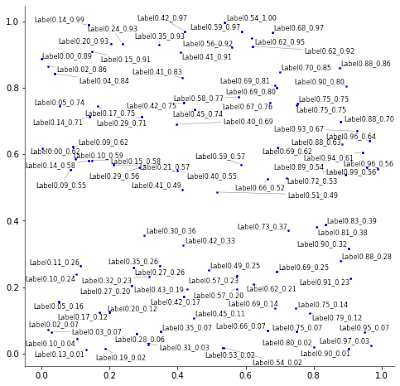
adjustTextを使って散布図を作成する。
adjustTextを使うとプロットに少し時間がかかるようになるが、良い感じに重なりがなくなった。
このように重なってしまっているテキストラベルを、PythonライブラリのadjustTextを使うと簡単に重ならないようにできる。以下にその手順をまとめておく。
環境
Windows10(1903)のWSL(Ubuntu 18.04)とJupyter Notebookを使用。
adjustTextのインストール
adjustTextはpipでインストールできる。
adjustTextでラベルが重ならない散布図を作成する
まずはadjustTextを使わずに散布図を作成する。
%matplotlib inline
from IPython.core.pylabtools import figsize

import numpy as np
import matplotlib.pyplot as plt

fig, ax = plt.subplots(figsize=(8,8))
ax.spines['top'].set_visible(False)
ax.spines['right'].set_visible(False)

np.random.seed(seed=1)
data_x = np.random.rand(100)
data_y = np.random.rand(100)
labels = ['Label{:.2f}_{:.2f}'.format(x, y) for x,y in zip(data_x, data_y)]

for x, y, l in zip(data_x, data_y, labels):
    ax.plot(x, y, marker='o', linestyle='', ms=2, color='blue')
    plt_text = ax.annotate(l, (x, y), fontsize=8, color='black')
ラベルがけっこう重なってしまっている。
adjustTextを使って散布図を作成する。
%matplotlib inline
from IPython.core.pylabtools import figsize

import numpy as np
import matplotlib.pyplot as plt
from adjustText import adjust_text

fig, ax = plt.subplots(figsize=(8,8))
ax.spines['top'].set_visible(False)
ax.spines['right'].set_visible(False)

np.random.seed(seed=1)
data_x = np.random.rand(100)
data_y = np.random.rand(100)
labels = ['Label{:.2f}_{:.2f}'.format(x, y) for x,y in zip(data_x, data_y)]

# adjustTextに渡すテキストラベルのリスト
texts = []

for x, y, l in zip(data_x, data_y, labels):
    ax.plot(x, y, marker='o', linestyle='', ms=2, color='blue')
    plt_text = ax.annotate(l, (x, y), fontsize=8, color='black')

    texts.append(plt_text)

# arrowpropsでラベルからプロットした点を指す線などの形状や色を指定
adjust_text(texts, arrowprops=dict(arrowstyle='-', color='gray', lw=0.5))
adjustTextを使うとプロットに少し時間がかかるようになるが、良い感じに重なりがなくなった。
0 件のコメント:
コメントを投稿